Why the economy is not the stock market (& what this means for you)
Do you ever wonder why markets can have positive returns yet the economy seems to be in the dumps?
You’re not alone.
The stock market is not the economy.
&
The economy is not the stock market.
2020 was a perfect case study of this in action.
The most common way economic growth is tracked is through Gross Domestic Product (GDP) which is the total value of goods and services produced within the U.S. year.
GDP growth quarter-over-quarter for the 2020 year was:
Q1 = +1.23% growth
Q2 = -7.53% growth
Q3 = -1.46% growth
Q4 = -1.08% growth

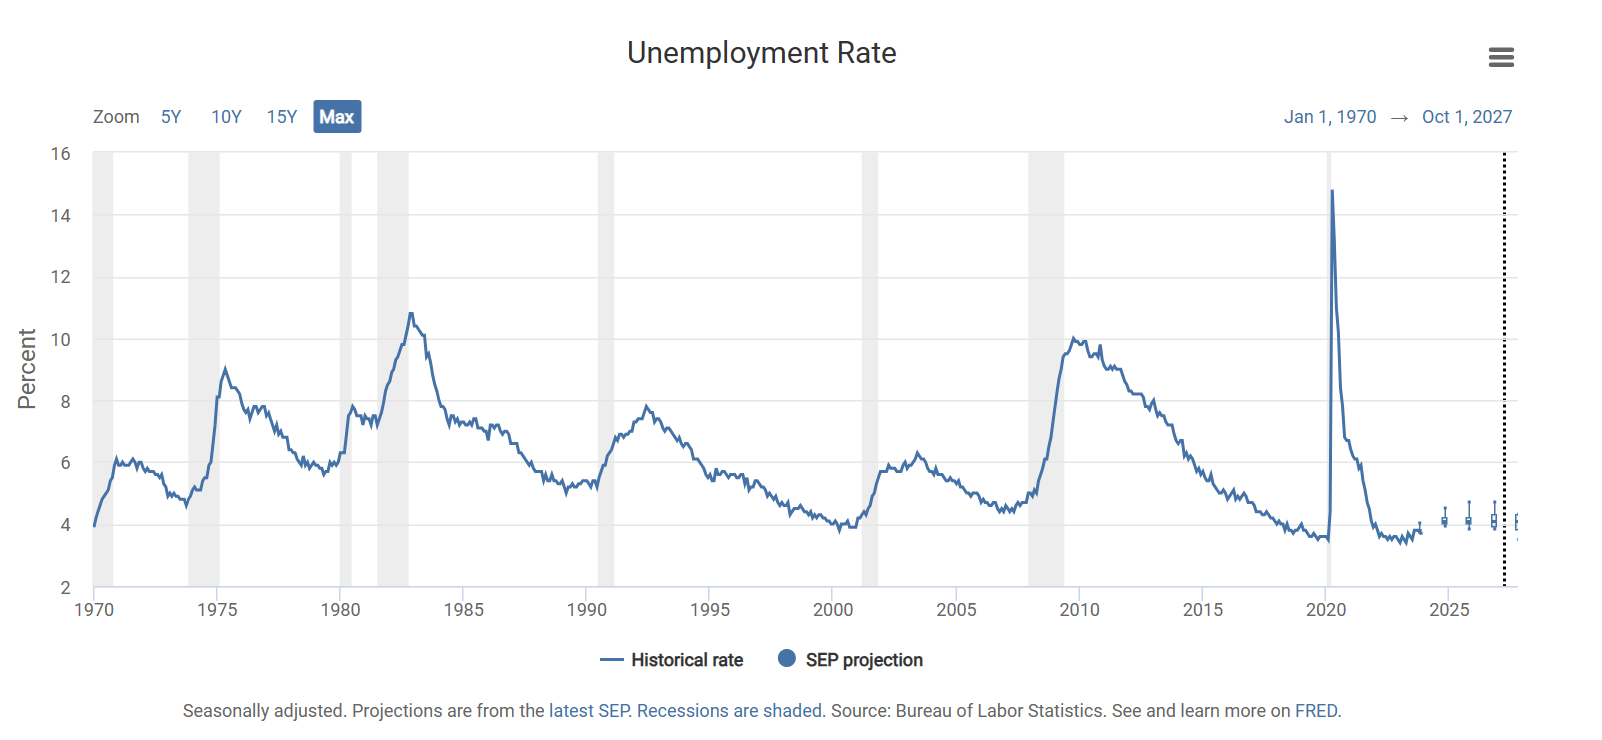
All while the unemployment rate skyrocketed over the same period of time:
Yet, if we consider the return of global markets, we see a total return of +14.31%:

So how can the economy be in shambles (quite literally shut down) & the stock market have such positive returns?
The answer?
The stock market is forward looking.
When you buy publicly traded security, what you’re buying is the rights to a company's current & expected future profits.
Market participants look ahead to see where a company is investing their money (& what their projected ROI will be of invested capital), what their historical and projected revenue growth rates and profit margins are (& how that’s trending over time), what’s the research and development in the pipeline (& how that is projected to perform in the market), how’s management doing at leading the company, etc.
This information is used to build out multi-year projections of company cash flows which are then discounted back to the present day to form an equity value of the company.
When expectations of company cash flows are positive, investors buy more shares and the company price increases.
When expectations of company cash flows are negative, investors sell more shares and the company price decreases.
So while this makes sense - where does this positive sediment come from in the depths of 2020 with all the COVID uncertainties?
It isn’t one thing, but a combination of multiple things that formed positive sediment for investors to feel confident.
Given markets' forward looking nature, as more information was gathered about COVID, the more confidence investors had that we would make it through this hard time.
There was also massive action taken by way of both fiscal and monetary policy (the Fed and Congressional action).
The Fed started off by cutting interest rates 0.
This encourages business and personal borrowing which will stimulate the economy.
Further, the Fed also purchases billions of dollars in Treasuries, and mortgage backed securities (& even corporate bonds…) in an effort to provide liquidity to the market.
This gave companies some additional cash to keep their lights on during this time.
At the same time, Congress introduced the CARES Act which was a 2 trillion dollar stimulus package designed to offer relief for businesses and families increasing unemployment benefits and issued direct payments to individuals.
Both actions from the Fed and Congress helped soften the blow during these challenging times and instilled confidence in the markets that help is on the way.
But that still leaves one problem - when we compare the economy and the stock market:
How GDP growth is calculated and how stock indices returns are generated aren’t good proxies to compare to each other.
GDP is calculated with a four part formula:
C + I + G + NX = GDP
C = personal consumption expenditures (consumer spending) = things people buy such as groceries, clothing, cell phones, health care, etc.
I = investment (business spending) = land, equipment, buildings, unsold inventory, etc.
G = government spending (federal, state, and local governments) = to provide goods and services, like schools, roads, and national defense.
NX = net exports (exports minus imports) = how much we export relative to the amount we import.
Compare this to how stock returns are generated through forecasting company expected future cash flows discounted to the present - it’s not a fair comparison (like comparing apples and oranges).
Zooming out and looking at stock index returns:
Consider the S&P 500 which is weighted based on market capitalization.
Market capitalization allows for the size of the underlying companies to make up its allocation in the index.
Consider that S&P 500’s total market capitalization is ~$40 trillion dollars.
Consider Apple which is $2.961 trillion dollars.
Apple’s weighting in the S&P 500 according to its size is 7.40% ($2.961T / $40T).
This goes on for the remaining 500 companies.
The issue you potentially run into here is larger companies that have outsized outperformance that can bolster the returns of the index overall.
In some ways, giving a fall sense of reality.
Is the stock market overall really doing well or just a few companies?
During COVID, this was Facebook, Microsoft, Amazon, Apple, and Google.
More recently, 7 stocks have been carrying the returns of the S&P 500.

Further, the S&P 500 tracks the 500 largest publicly traded U.S. companies.
What about the remaining medium and small publicly traded U.S. companies?
They’re not considered in this index.
All this being said, the market’s anticipation of positive sediment proved correct as unemployment fell to more normal levels and GDP growth bounced back as we look back on 2021.
So what can you take away from this?
The economy is a leading indicator of how the market could perform in the future but doesn’t tell the full story.
Expectations of companies' future cash flows drive market returns in the present.
Indices are disproportionately weighted towards larger companies and don't incorporate smaller publicly traded companies.